
Population Biology/Ecology has strong claims to importance and relevance to students. In this time of enormous manmade effects on species, endangered and invasive species, epidemics, rising rates of extinction and rapid climate change, an understanding of the dynamics of biological populations, predator prey interactions and species/environment dependencies, is a necessary requirement for managing that impact. A first step is an understanding of the dynamics and characteristic patterns of population change. Moreover, such an understanding is preparatory and fundamental to understanding evolution: as biodiversity, carrying capacity of an environment, ecological niches and characteristic boom-bust cycles provide the theoretical substrate on which evolutionary mechanisms and natural selection can operate. Despite its importance, little more than qualitative understanding can be achieved in traditional secondary school treatments as the mathematics is a barrier.
The agent-based approaches adopted by the computational models in this unit can deliver both qualitative and quantitative models with minimal algebraic formalism yet powerful modeling capability. In addition, these models serve as powerful test-beds for students to design and conduct experiments to analyze data and construct scientific explanations for the mechanisms and patterns underlying population dynamics. Each activity begins with a pre-class discussion to introduce students to the central question of the activity and to elicit students’ prior ideas about the topic. After students have interacted with the model, either alone or in small groups, the teacher facilitates a consensus-building discussion in class to synthesize what students learned. This state-of-the-art curriculum has been designed to closely align with the Next Generation Science Standards in terms of the scientific practices that students engage in as well as the performance expectations and disciplinary core ideas addressed in the unit.
Over the course of the unit students investigate a real-world case study of an ecosystem (Isle Royale) over a 50-year period to analyze data from the moose and wolf populations on this island. Special thanks to the John Vucetich and Rolf Peterson, for their permission to reuse their excellent images, text, and research data from http:// http://www.isleroyalewolf.org/ in the case study for this unit. The context of this ecosystem is used to construct explanations and argue from evidence to answer the question “How Do Populations Change?” The answer to this question develops further with each new lesson, as students contribute new questions and new discoveries to what the class figures out. Each lesson students contribute new discoveries that apply to all populations of organism that they make through the investigations to the Driving Question Board, a publically posted space that captures and displays these ideas. And they contribute new questions and discoveries they make related to the Isle Royale case study to the class Case Study Board.
At the end of the unit, students construct a scientific explanation answering the question “Is Isle Royale a stable ecosystem?” The explanation helps students integrate important mechanisms they learned about in the unit related to interactions, competition, resource availability, birth/death rates, fluctuation/stability, and environmental changes. And students integrate evidence from the ecosystem and from the computer investigations they gathered along the way. Typically, students develop alternate explanations to this question, as some students start with very different claims about whether the ecosystem is stable. This controversy facilitates further argumentation from evidence where students are asked to evaluate competing arguments [claims, evidence, and reasoning].
Description of the Activities in Each Lesson
Lesson 1
What types of interactions affect populations of organisms in ecosystems?
Performance Expectations:
- Students use a model of a food web to describe how a change in the size of a population and/or a change in the resources available in the environment would affect the size of other populations in the ecosystem.
Description
Students observe a photograph two real world ecosystems and describe some of the changes they expect to see in that ecosystem over the course of a week, a month, a year, and 30 years. The class develops a definition for an ecosystem and an interaction. The class builds a physical food web of a pond ecosystem as an entire class using string and index cards. The class uses this model of the ecosystem food web to visualize and predict various forms of interactions between populations, describing indirect and delayed effects on population size as other population sizes and resources necessary for survival change in the ecosystem.
Through discussion, the teacher helps build consensus on types of interactions in ecosystems and indirect vs. direct effects, and immediate vs. delayed outcomes. The class also discusses how using a model of an ecosystem helped them understand, predict, and explain various outcomes.
In their homework students describe what type of objects and interactions they think might be important to include in a computer simulation of an ecosystem, to connect to their upcoming work (throughout the rest of the unit) using computer based models. This homework also helps students understand what it means to use modeling as a scientific practice and models as scientific tools (such as the ecosystem model they made in class).
Lesson 2
What factors influence the size of the wolf and moose populations on Isle Royale?
Performance Expectation
- Students obtain and communicate information from text and verbal presentations about the physical structures, behaviors/metabolism, and resources needed for survival, and environmental factors that affect wolves and moose populations on Isle Royale.
Description
Students read and summarize a general introduction to the Isle Royale ecosystem, with a particular focus on two populations: the wolves and moose that live on the island. They analyze graphs of the wolf and moose population sizes for the first year that data was collected (1959) and for a recent year that the data was collected (2010). They draw predicted graphs for population sizes for the years between these two points.
They then meet in small groups and break up the responsibility for researching more information about one of these populations in another short reading (a different reading is assigned to each of the four group members). They share their findings with the group members and write a brief summary of each other’s discoveries.
The class brainstorms possible factors that might cause the population size to change (or not change) over time and questions they now have about the case study. They share these and post these on the Case Study Board.
In their homework students analyze graphs of the wolf and moose population sizes for the first 5 years that data was collected (1959 to 1963) and plot data for the next nine years (1963 to 1970).
Lesson 3
What Causes Competition Between Individuals in an Ecosystem?
Performance Expectations
- Use mathematical thinking to 1) compare an individual’s success at gathering resources from an ecosystem to other individuals in the population and 2) compare the performance of different populations in a participatory simulation.
- Use mathematical thinking to determine the average amount of food available in an ecosystem per individual consumer as the size of the consumer population changes.
Description
In this lesson, students are introduced to a participatory computer simulation where each student takes the role of an individual consumer (a bug) in an ecosystem. Students make predictions about various model runs and compare their predictions to the outcomes they observe. In one exploration they control the direction of movement of a bug, trying to gather as much food (grass) as possible in a variety of conditions. In another exploration they observe the outcome when many bugs move randomly and blindly around an ecosystem consuming food without any intentional control. Students recreate a physical representation of a histogram graph (of energy levels of bugs) from NetLogo and analyze characteristics of the population in the graph to draw comparisons between populations and individuals.
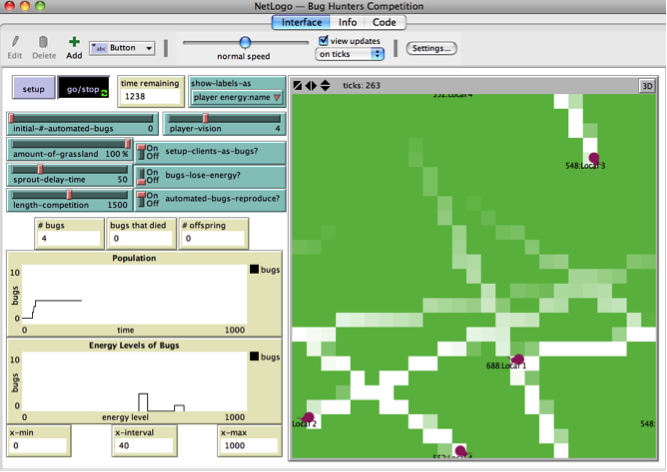 Bug Hunt Consumers NetLogo Model
Through discussion, the teacher helps build consensus about what they discovered: Competition is an emergent outcome that results from 1) limited resources necessary for survival, 2) and unequal distribution of those resources throughout the ecosystem, 3) and from interactions (intentional or unintentional) that always are occurring between each individual and their environment.
In their homework students address the difference between intentional and unintentional competition further. They critique the modeling assumptions used in the computer simulation. They describe the variation in local resource availability for individuals in the computer model. They calculate how changes in the amount of grass or amount of bugs in would change the average amount of grass per bug in the ecosystem and they identify that ecosystems with lower average grass per bug would have higher levels of competition than those with higher average amounts of grass per bug.
Lesson 4
How do population sizes in an ecosystem change over time?
Performance Expectation
- Use mathematical and computational representations from investigations to support explanations of factors that do not affect carrying capacity of ecosystems. NGSS HS-LS2-1
Description
Students observe the behavior of a wobbling cereal box and use this to define characteristics of stable systems. Students are shown how to interpret the graphs in NetLogo models that are dynamically updating. They use the computer model to explore to determine that changing the initial number of bugs, introducing disease, or adding bugs during a run does not affect the stability of the ecosystem.
Bug Hunt Consumers NetLogo Model
Through discussion, the teacher helps build consensus about some of ways that populations sizes change in ecosystems – exhibiting minor fluctuations, cyclical fluctuations, while remaining relatively stable under certain environmental conditions. They discuss how counterbalancing forces of deaths and births affect the amount of food available per individual in the ecosystem.
In their homework students interpret NetLogo model run graphs for stability and fluctuation and critique modeling assumptions of the NetLogo models. They analyze data from some real-world predator-prey ecosystems to determine the usefulness and validity of the computer model.
Lesson 5:
How Do Sizes of Populations Change Over Time?
Performance Expectation
- Use mathematical and computational representations from investigations to support explanations of factors that affect carrying capacity of ecosystems. NGSS HS-LS2-1
Description
In this activity, students make predictions about how different initial conditions affecting amount of resources available in the ecosystem will affect the stability of the bug population size. From their model runs, students record observations about fluctuations in population size and stable states (equilibrium levels) for each population to test their predictions.
Through discussion, the teacher helps build consensus about some of ways that populations sizes change in ecosystems – exhibiting minor fluctuations, cyclical fluctuations, while remaining relatively stable under certain environmental conditions. They discuss how sustained environmental changes lead to new stable states for the ecosystem.
In their homework students brainstorm other types of environmental changes and read about the sources of evidence scientists use to figure out how the environment changed in the distant past. They read about some of the type of climate changes and biological changes that have occurred on earth over the past 3.5 billion years.
Lesson 6:
How Do Populations Affect Each Other in Ecosystems?
Performance Expectation
- Use mathematical and computational representations from investigations to support explanations of factors that affect carrying capacity of ecosystems. NGSS HS-LS2-1
Description
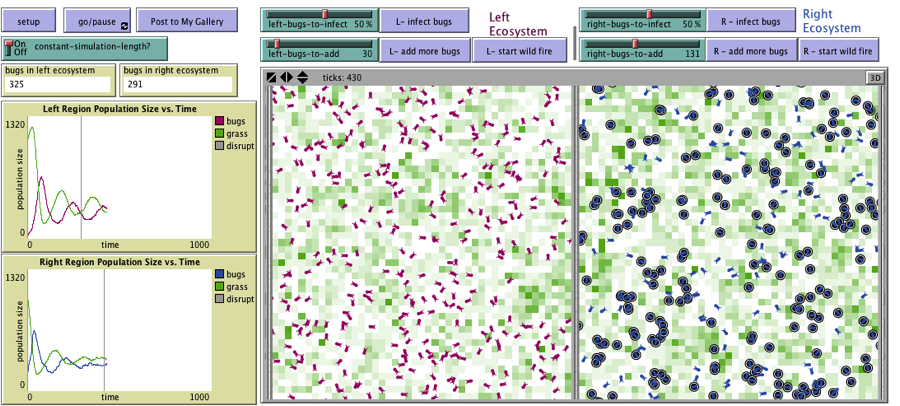
Students use the computer model to investigate the interactions between producers and consumers and predators of the consumers, noting the delayed affects between population peaks in each population. They adjust the attributes of all the individuals in one population to see how such changes in that trait affects the carrying capacity and fluctuations of that population. They also introduce an invasive species, adjusting how much it eats, to see how this population affects competition between it and the native consumer (the bugs) They analyze why population fluctuations still exist in both the invasive species and native species for certain conditions and why in other conditions one population disappears.
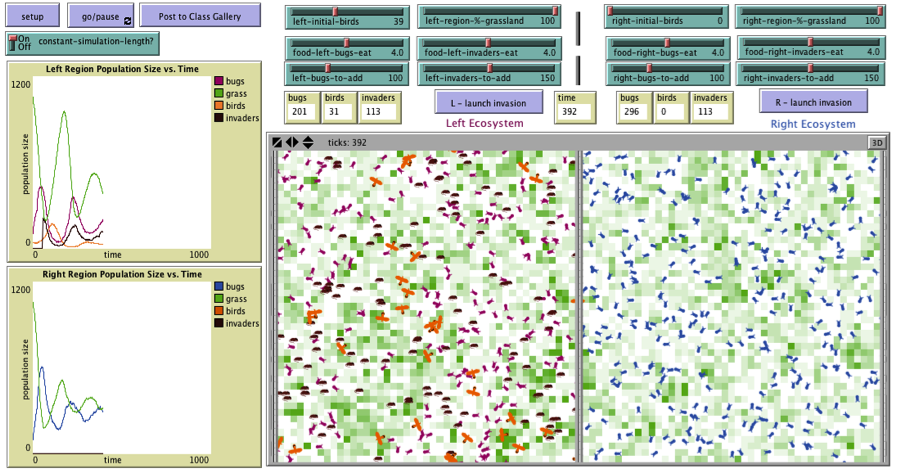 Bug Hunt Predators and Invasive Species NetLogo Model
Through discussion, the teacher helps build consensus about how populations interact with each, revisiting ideas from activity 1. They discuss how populations affect the stability of each other, revisiting ideas from activity 3, and they describe how populations compete against each other, extending ideas from activity 2 noting that unintentional competition between individuals for the same resources could result in unintentional competition between populations.
In their homework students are introduced to historical examples of where invasive species outcompeted an invasive species and where severe environmental change caused native species to die out in a region or when it prevented an invasive species from entering a new region. They brainstorm some possible changes in the traits of a population that they think might help it outcompete other populations in an ecosystem.
Lesson 7:
Can You Design a Population That Will Outcompete All Others?
Performance Expectation
- Design and test the traits for populations within a computer model to determine if a population can be designed to outcompete all others in an ecosystem and never go extinct.
Description
Students are introduced to a new participatory computer simulation where each student takes of a critter designer. They design the movement behavior, reproductive behavior, and if their critter is a consumer or predator, and they release a critter into an ecosystem in an attempt to outcompete other populations of critters that other students release into the ecosystem. As a class they investigate whether they can create at least one species of critter, which outcompetes all other species all the time, even as the environmental conditions are changing. They discover that this is impossible.
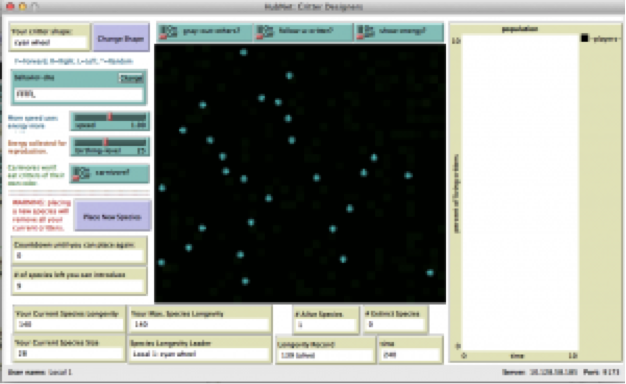 Critter Designers NetLogo Model
Through discussion, the teacher helps build consensus about how changes in the environmental conditions and interactions affected the success of their population, why different trait combinations have different competitive advantages (different fitness) for survival, and why no single “design” is optimal all the time in a changing environment. This discovery partially motivates the investigation of the evolution WISE project as a future unit of study.
In their homework students learn about other major environmental changes that have occurred over the history of life on Earth. They describe why environmental changes would change the competitive advantage for a set of traits in an ecosystem. They predict whether variation in individual attributes would increase the likelihood or decrease the likelihood of some individuals form their population surviving for various populations.
Lesson 8:
Is the Island Royale a stable ecosystem for the wolf and moose populations?
Performance Expectations
- Construct a scientific explanation based on evidence from ecosystems and computer models to answer the question: “Is the Island Royale a stable ecosystem for the wolf and moose populations?”
- Present and evaluate competing arguments that the complex interactions in an ecosystem (Isle Royale) either A) are maintaining relatively consistent numbers and types of organisms in stable conditions or B) will result in a new ecosystem (unstable) due to changing environmental conditions. NGSS HS-LS2-6
Description
The teacher reviews the homework and summarizes a final scientific principle from a class discussion about life on earth and the fossil record. The teacher introduces the structure of a scientific explanation and the goal of the summative assessment.
Then students work in teams to summarize a list of scientific principles that are relevant to this argument and summarize the data relevant to this argument.
Then the students work on their own to annotate the population graph data from the population data for wolves and moose over 60 years and write a scientific explanation synthesizing this analysis.
Then students present to small groups or the whole class, defend their argument to their peers, and individually question and evaluate competing arguments.
Lastly each student works individually to add a rebuttal to these alternate explanations into their scientific explanation as homework.